Skip to content
Independent Baseball Analysis Fri, July 10, 2026
Called Third

Same Stuff, Different Brain

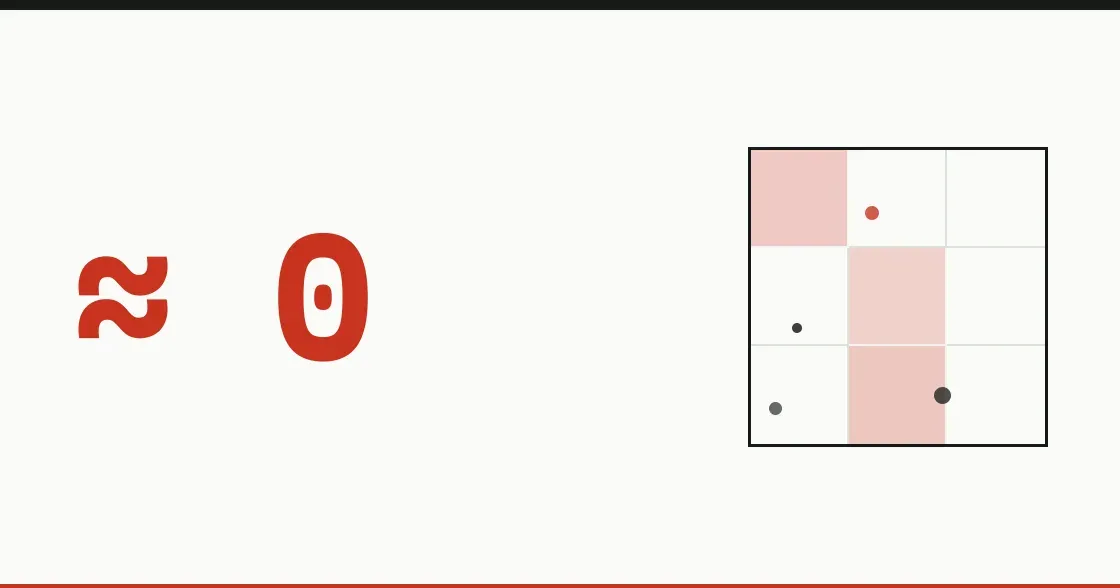
Two starters can throw the same pitch — same velocity, same movement, same slot — and get different results. The gap between what a pitcher’s raw stuff predicts and what he actually allows is a real, repeatable skill worth about 26 runs a season. We built two independent models to hunt for what it is — location, sequencing, the ballpark, the catcher — and eliminated every suspect. The edge repeats year to year at 0.59, and the two methods agree on it at 0.91. It isn’t the park and it isn’t the catcher; roughly 85% belongs to the pitcher. The brain is real. Nobody can name it yet.

What’s Real and What’s Noise in the Bullpen Ledger

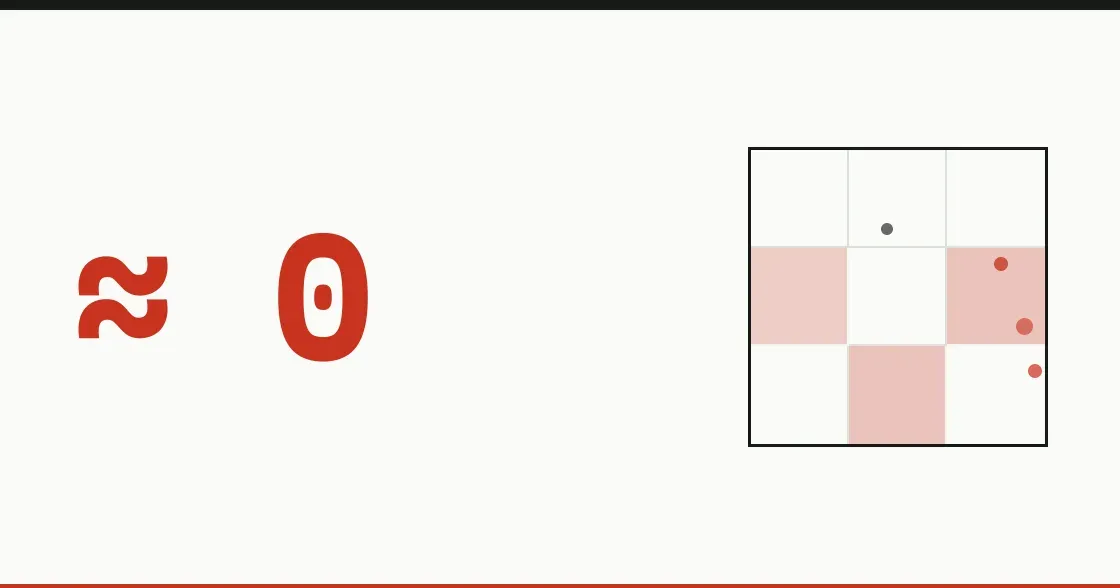
How a reliever throws repeats year to year; what the bullpen ledger credits him for barely does. A reliever’s velocity carries over at 0.95 and his whiff rate at 0.63, but his win-probability output carries over at just 0.13 — and within a single season it correlates with itself at only 0.17. We made two independent methods fight over it across 177 relievers. The skill is real and durable; the scoreboard is nearly random. The blown save is a true account of what happened, not a verdict on the pitcher.

The Firemen the Save Stat Can’t See

83% of the win probability relievers create happens outside save situations — the save stat watches the smallest slice of the bullpen. We added up the wins relievers actually bank across 8,092 relief appearances, then made two independent methods fight over the names. Colin Holderman has been one of the most valuable relievers in baseball this year with zero saves; value and save credit correlate at just 0.22. We name the hidden firemen on win-probability magnitude, never on rank — because at a half-season the order is noise.

The Fielder’s Fingerprint: Two Gloves, Same OAA, Opposite Skills

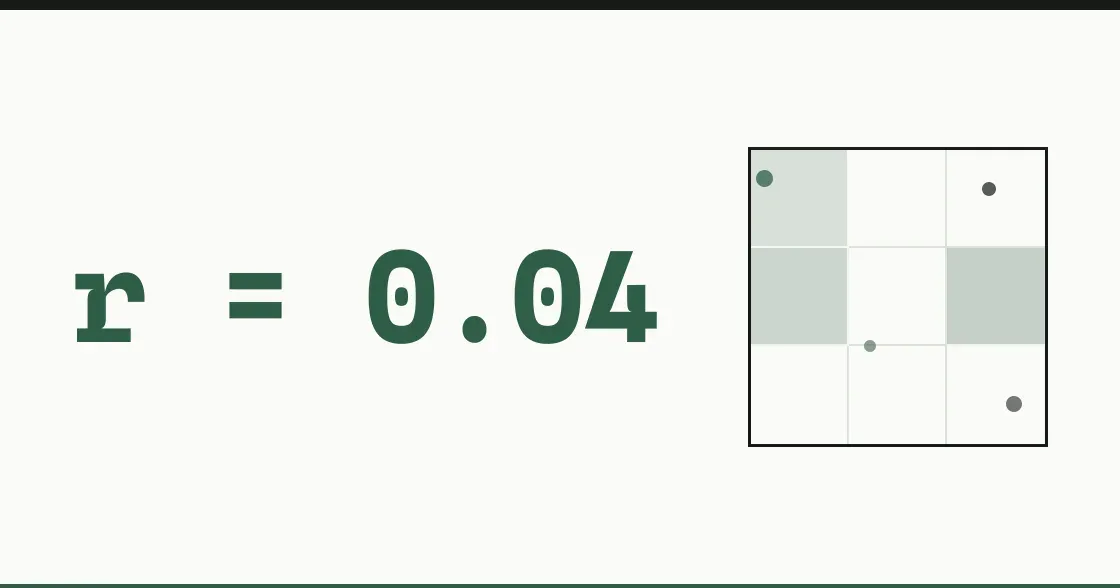
Outs Above Average gives every fielder one number; it hides a direction. We split five seasons of directional OAA into the outs a fielder earns charging in versus covering deep — his “tilt” — and made two independent methods fight over it. The tilt is a real, repeatable skill (YoY r=0.28, ~0.29 at short, center, and left) that has nothing to do with sprint speed (r=0.04), and OAA averages it away: 37 same-position pairs in 2025 had matching OAA and opposite gloves. Lindor charges in, Baez covers deep — same number, opposite craft. The honest limit: it’s a fingerprint, not a forecast.

A Bad Start Is Forever. A Good One Isn’t.

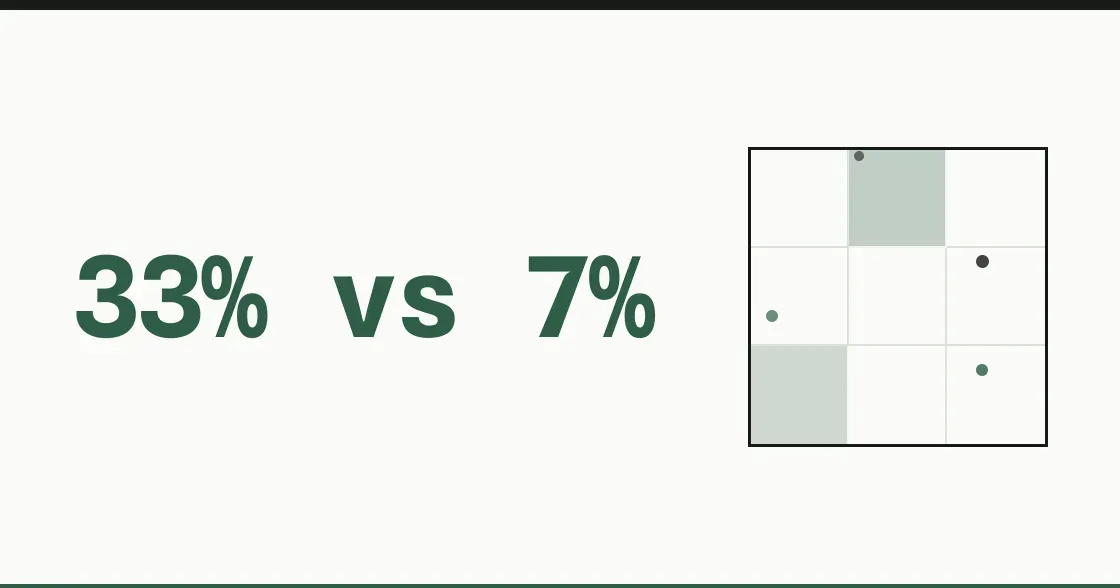
Every July, fans ask which first-half teams are real. We pooled five full seasons (2021-2025, 150 team-seasons) and tested it out of sample. A team’s quality is real (random-split r=0.74), but the first half predicts only about a THIRD of the second — and almost all of that third is in the basement. A bad first half predicts the second at R2=0.33; a good one at just 0.07; the .500 muddle is noise. 82% of clearly-bad starts stayed buried vs 67% of good ones staying up — gravity pulls down harder. The signal locks in by ~game 40 (Memorial Day); run differential and the plain record predict it best (fancy stats add nothing); bat speed is noise. Plus: the biggest frauds (2023 Angels 44-37 -> 29-52) and what the rule says about 2026.
The Jump Tax: The Steal Is a Decision, Not a Physique

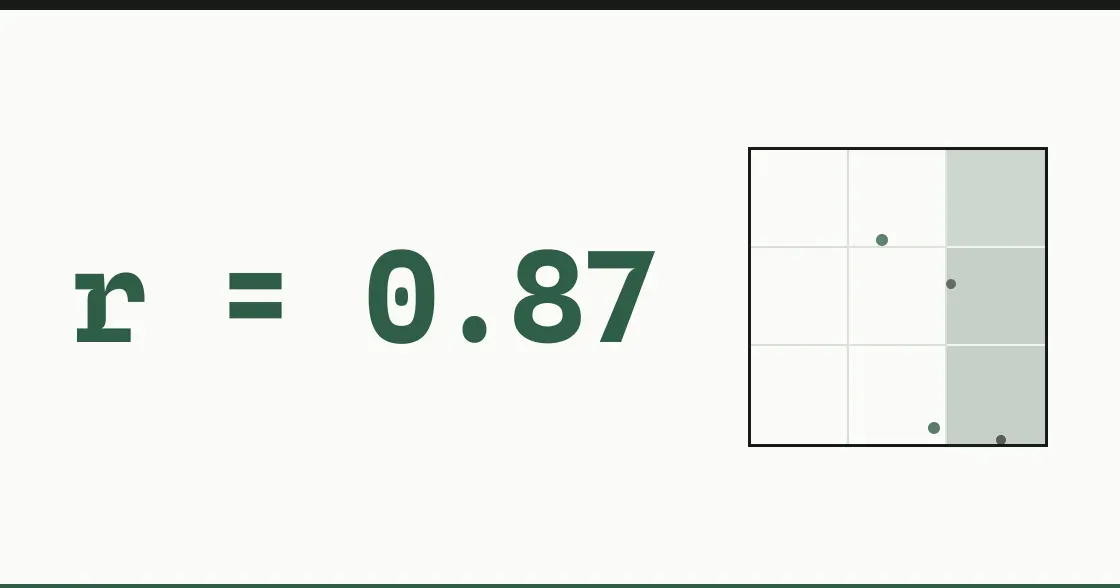
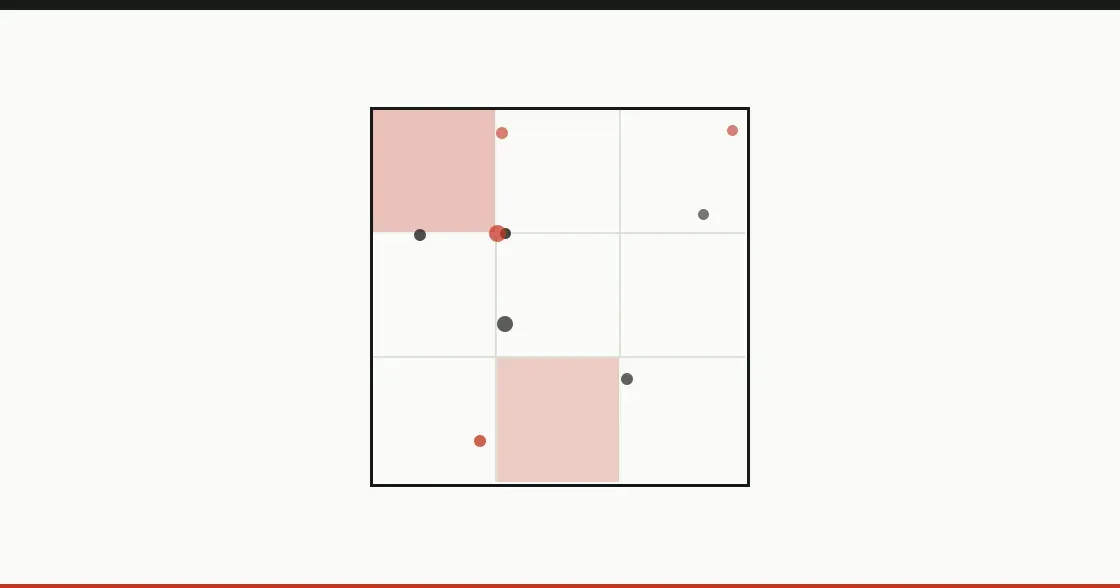
Josh Naylor is among the slowest runners in baseball and stole 22 bases in 23 tries in 2025. Not with his legs, and not with a big lead — his resting lead is 3rd-percentile — but with an ambush: on the pitches he picks, his lead jumps to the 97th percentile, the biggest standing-to-go swing in the game. We decomposed the stolen base across 70 qualified runners with two independent methods over three rounds. The jump and the legs are real, separable, remarkably repeatable skills (the jump persists year over year at 0.79) — but neither predicts who actually banks steal value. That is conversion, which tracks run value at r=0.87 and barely repeats. Single-season steal value is ~44% small-sample noise. There are two ways to be elite — pure speed (Buxton) or pure ambush (Soto, Naylor) — and they bank the same runs.

The Adjustable Swing: Hitters Have a Dial. It Isn’t Wired to Anything.

Statcast started measuring the shape of a swing in 2025 — the attack angle — and the instruction industry turned it into a product. So we tested the premise: do hitters adjust their swing shape to the pitch, and does it help? The first half is true and genuinely cool — hitters have a ‘dial,’ steepening ~10° on low pitches and flattening on high ones, and how much they turn it is one of the most reliable, year-over-year-stable traits in hitting (split-half 0.94; two independent methods agree on who at r=0.99). The second half isn’t: the dial adds no power (its effect can’t be told from zero once you know a hitter’s bat speed and average swing shape), and it doesn’t save contact either — the more adjustable hitters whiff slightly more, worst at the zone extremes where matching your plane is supposed to help. ‘Ideal attack angle rate,’ the marketed metric, is ~88% bat speed. The least-adjustable qualified hitter in baseball is Juan Soto. Two independent methods, two adversarial review rounds; the cross-review caught and killed a contamination bug before it could ship.

The Arm-Angle Gambit: We Went Looking for the Cheat Code. We Found a Tax.

Pitchers across baseball are dropping their arm slots, chasing the pitch-lab promise that a lower release unlocks a sweeper and a new level. We priced the gambit within-pitcher across 374 arms, two independent methods, two adversarial review rounds. The slot credit is indistinguishable from zero five different ways — and the study’s most interesting number (+0.28 runs/100 for the bundled repertoire change) died in cross-review as target leakage; rebuilt clean, both methods land at ≈+0.03, the same as pitchers who never moved. The one effect that survives: droppers lose an average 0.46 inches of four-seam ride (10 of 15, Wilcoxon p=0.011) while stable arms gained. The scoreboard among the 16 droppers: nine better, seven worse — a coin flip. Early-signal by design; full re-test queued for the All-Star break.

The Two-Strike Brake Belongs to the Pitcher, Not the Hitter

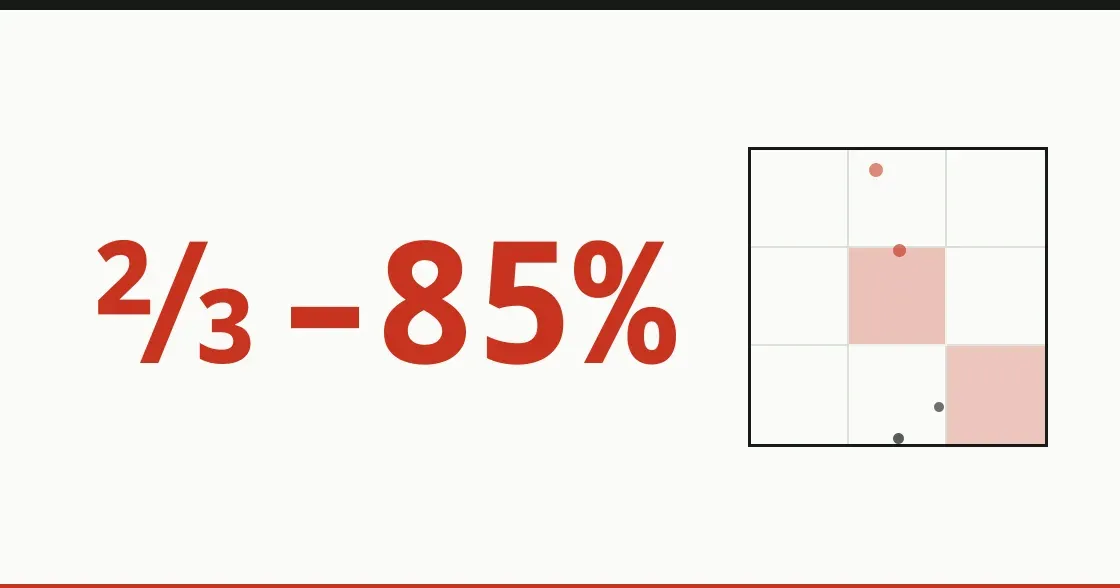
We set out to build the hitter version of the Pressure Grade — one number for how a hitter changes gears with two strikes. Two independent models, run blind to each other, converged on the same answer: the famous −1.4 mph two-strike bat-speed ‘brake’ is mostly a mirage. Roughly two-thirds to ~85% of it is the pitch a hitter is thrown (slower, softer, lower) with two strikes, not a decision. The real adjustment is small (~−0.3 mph), lives in swing shape not speed, and — while a stable year-to-year signature (r=0.73, two methods agree per-hitter at r=0.98) — adds about one-thousandth of AUC to predicting two-strike whiffs over the stats already on a hitter’s card. A descriptor, not an edge.

Hitters Are Chasing More Under the Robo-Zone

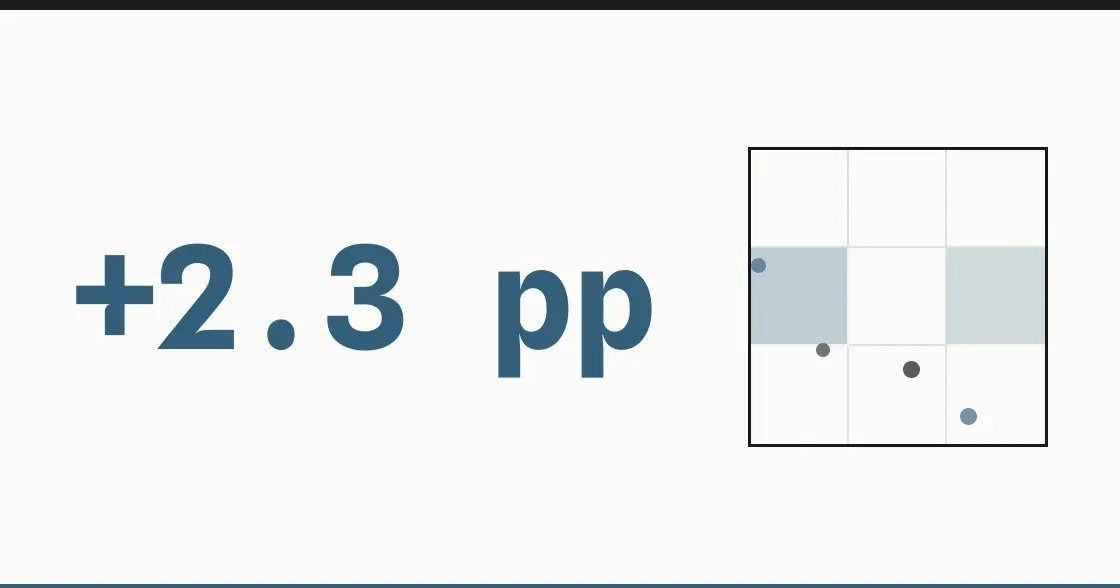
A precise automated strike zone was supposed to reward patience. Through 2026 so far, the league is chasing more, not less — out-of-zone swing rate is up from 30.0% to 32.3%, a +2.3-point jump. And it isn’t a calendar trick: the rise holds when we compare the exact same March–June window in both seasons. We report the pattern, not the cause — but the simple story, that a fair zone makes hitters more patient, is not what the first season of full ABS shows.

We Tried to Build a Pressure Grade. Most of It Was Skill in a Costume.

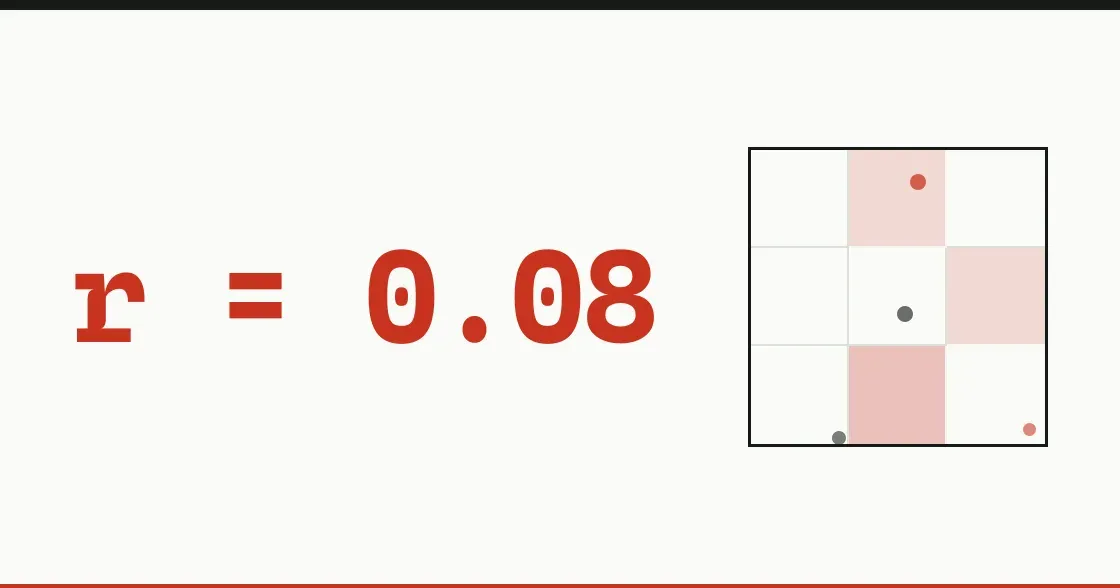
Everyone has a read on who melts down and who locks in. We tried to turn it into a number two independent ways — a Bayesian pipeline and a gradient-boosted ML pipeline, six seasons, 3.85M pitches. The single ‘Pressure Grade’ doesn’t exist: the clutch residual is noise (r=0.08, a coin flip), and no composite beats a pitcher’s plain overall skill out-of-sample — it loses or ties. Our own headline hypothesis — that command separates the pressure-proof — failed out-of-sample. But the multi-dimensional read survived: the two methods grade each pitcher’s stuff/command/contact nearly identically (stuff agreement r=0.95), and a pitcher’s overall skill predicts his future high-leverage results better than his past high-leverage line does. The honest version is now on every pitcher’s page.

The Bat-Speed Arms Race: We Went Looking for the Treadmill. It Isn’t There.

Hitters keep swinging harder and MLB offense keeps slipping, so the take writes itself: everyone’s selling out for bat speed and whiffing for it — a treadmill. We tested it on 254 hitters across two seasons of bat tracking and couldn’t find it. Within a hitter, adding 1 mph of bat speed (2025→2026) is worth about +0.27 runs/100 PA — a modest positive lean, not a penalty — and it comes with no whiff cost at all (exit velo +0.66 mph and xwOBAcon +12 pts per mph, whiff flat). The 2026 ‘offense crisis’ is mostly the calendar: against the matched window, the tracked-swing population is flat and bat speed actually rose. The elegant ‘free vs bought speed’ story is a clean null, and the result survives an explicit attrition correction (bat speed doesn’t predict who washes out). Two independent pipelines (interpretability-first + ML) and two cross-review rounds. Borderline by design — re-test at the All-Star break.

The Two-Strike Swing: Not Shorter — Slower, Flatter, and Deeper.
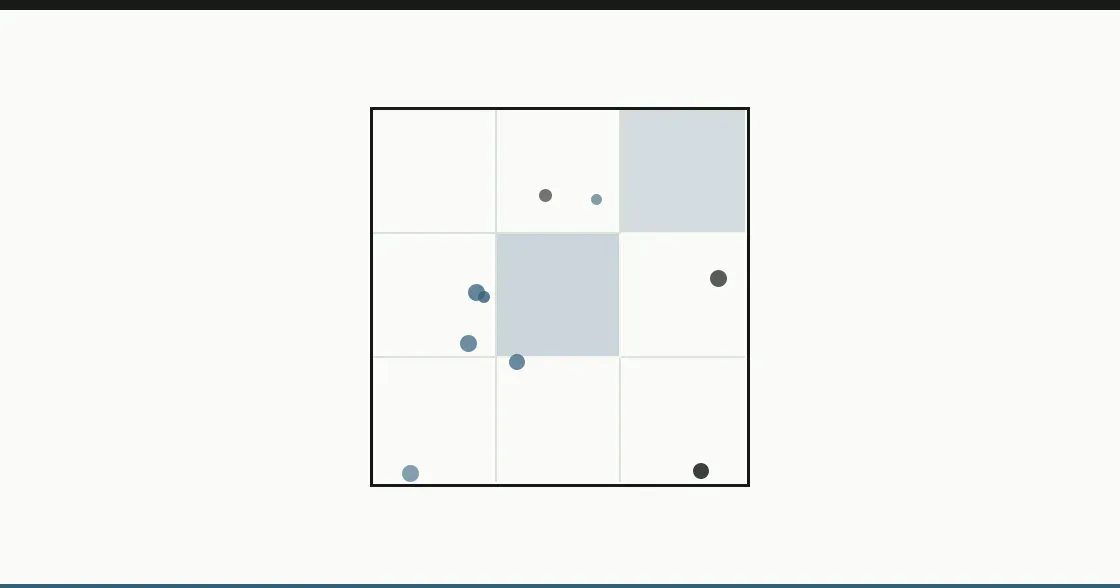
Every coach says ‘shorten up with two strikes.’ Bat-tracking from 332,111 swings says the swing barely shortens (−1.3%). What hitters actually do is one coordinated compact move: slower (bat speed −1.8 mph), flatter (attack angle down ~1°, and more once you control for location), and deeper (contact point about an inch closer to the catcher). Roughly 60% of hitters make all three adjustments at once — a geometry that, as far as we can tell, has never been published. The brake buys contact (the biggest decelerators cut their two-strike whiff rate ~3pp) at a cost of ~30 points of xwOBAcon. Andrés Giménez is the league’s brake artist in both 2025 and 2026; Victor Scott II is the mirror image — he speeds up AND steepens. Every finding was independently reproduced by two analysis pipelines and replicates in 2026.

Umpires Don’t Have Personality Types. They Do Have an Outside Corner That Spans 19 Points.

We pre-registered an attempt to cluster 83 home-plate umpires into discrete calling-style types. Two independent statistical methods both refused — four of five kill gates fail in both, including an inter-method ARI of 0.105 against a 0.30 threshold. But on the outside corner, the league spans 18.9 percentage points: Stu Scheurwater calls outside-corner strikes 12pp above league baseline; Alex MacKay calls them 7pp below. The asymmetry isn’t catcher framing (r > 0.94 after dropping top framers). And on count-conditioned zone behavior, three independent location-controlled methods agree the broadcaster myth has the sign backwards: umpires CONTRACT the zone on 0-2 by ~18pp, not expand it.

Three Weeks Later: The Walk Spike Is Fading, and We Know Who’s Paying the Bill

Three weeks ago we said about half the walk spike was the new ABS zone. With two more weeks of data and a much harder analytical pass: the number has muted to ~+26%, the spike is fading (W1 9.61% → W7 8.79%), and we can now name the pitchers paying the price. Three pitchers cleared bootstrap stability in both pipelines: Kyle Finnegan (command-archetype, +11.4pp walks), Riley O’Brien (stuff-helped, −8.3pp), Camilo Doval (stuff-helped, −7.5pp). Spearman ρ ≈ −0.27 between stuff-minus-command and walk-rate change, both methods.

We Tested the 7-Hole Tax Six Different Ways. It Isn’t There.

Two national outlets reported that umpires call a different strike zone for hitters in the 7-hole. We ran two independent statistical pipelines on every angle the claim could hide in — raw replication, pitch selection, borderline-pitch zones, per-umpire, per-hitter, and the catcher mechanism. Six tests, two methods, two cross-reviews. All null. The bias claim is not in the data we have.

The April Sell List

Six MVP-pace April hot starts that two independent statistical methods say won’t last — Pages, Rice, Trout, Judge, Carroll, Muncy. Six sleepers baseball isn’t talking about that both methods independently flagged as real. And the one big name we couldn’t make up our minds about (Murakami, with caveats). Three rounds of independent dual-track analysis, two cross-reviews, one retraction.

ABS Took the High Strike — and That’s Roughly 40-50% of the Walk Spike. Pitchers Own the Rest.

Two weeks ago we said the walk spike was pitchers, not umpires. Two independent ML pipelines and a counterfactual replay later, we’re back to update that. The 2026 ABS-era zone shrank at the top edge, and the zone change accounts for roughly half the walk spike. We were wrong to dismiss it at zero.

The Coaching Gap That Lives Where Hitters Don’t Chase

Six rounds of independent dual-track research on 2.9M pitches across five seasons. One finding survived: low-chase hitters extract +0.04 wOBA more on predictable pitches than high-chase hitters. Power doesn’t matter. Contact rate doesn’t matter. Discipline does.
The Physics Behind the Tunneling Atlas

Trajectory equations, model validation (4.9" systematic bias that cancels for relative comparisons), decision-point sensitivity analysis, and how to reproduce the tunneling model.

The Pitch Tunneling Atlas

654 pitchers. 739,820 pitches. The first league-wide tunneling model. Plate diversity explains 11x more whiff variance than decision-point similarity — but tunneling IS real (p=0.016).

Minnesota Buys Leverage. Cincinnati Buys Certainty.

The Twins and Reds are solving ABS in opposite ways. Minnesota: 3.2/game, most total value. Cincinnati: 72% overturn — the highest in baseball, with 91.7% in early counts.

The Best ABS Challengers Are Catchers

940 challenges. Catchers overturn 60.6% vs batters’ 45.5% (OR=1.85, p<0.001). They challenge closer pitches and still win more — in every count bucket.

ABS Isn’t Rewriting Every At-Bat. It’s Repricing the Last Pitch.

3-2 is just 2.8% of called pitches but generates 24% of all ABS run value. Late counts dominate the challenge economy while 0-0 is noise.

Cam Schlittler’s Three-Fastball Blueprint

231 pitches, 22 K, 0 BB. Schlittler rebuilt his arsenal into a perfectly balanced three-fastball attack — 100th percentile usage balance, 20.6“ of horizontal spread, and a remade cutter with +7.2” of vertical break.

After a Fight, the Zone Gets Cleaner

7 bench-clearing brawls, 6 complete pairs. The zone doesn’t expand or shrink — but accuracy improves unanimously (+2.0pp, p=0.001). Umpires stop giving freebies off the plate.

The Wrong-Way Slider: Imai’s Impossible Pitch

Tatsuya Imai’s slider breaks 10.4 inches the wrong way — 0th percentile among all RHP sliders. League-wide data shows arm-side-breaking sliders get 4.2pp fewer called strikes on edge pitches.

The Walk Rate Spike: Umpires or Pitchers?

Walk rate is up nearly a full point in 2026. The obvious suspect is ABS squeezing the zone. The data says pitchers are nibbling more — shadow-zone strike rate actually rose +4pp.

CB Bucknor by the Numbers

4,174 pitches, 3rd worst accuracy in MLB, and the highest average miss distance of any umpire. A data profile of baseball’s most controversial umpire — now that ABS can measure it.

The Fireman’s Dilemma

4,044 reliever entries, 6,516 inherited runners. The outs gradient determines most of the outcome: 44% strand at 0 outs, 82% at 2 outs. Whether individual strand rate is skill or noise remains an open question.

Do Pitchers Lose Their Command?

4,892 starts, 729K pitches. The average pitcher’s scatter is flat. But 14% of starts produce a scatter blow-up, and the distribution is asymmetric. Garrett Crochet’s scatter increases 31.5% on average.

Four Kinds of Zone

83 umpires, 380,000 pitches, and a 21-percentage-point gap in borderline strike rates. A two-axis framework that tells you what to expect from tonight’s home plate umpire.

The Umpire Effect: How Much Does It Matter?

For every game this season, we computed the run-value impact of every wrong call. CB Bucknor’s BOS-CIN game tops the list at 4.08 wOBA — roughly 4 runs shifted by umpire errors in a game decided by 1.

The Challenge System Is Quietly Favoring Defense

541 ABS challenges, 55% overturned, and a 10-percentage-point gap between the fielder side and batters. Plus: the count tradeoff, the late-inning fade, and why defense has captured 4.8 more runs than offense from the challenge system.

Which Pitchers Can You Predict?

We trained XGBoost on 729,827 pitches to predict the next pitch. The broad model barely beat the count baseline — but five pitchers stood out. Chris Sale’s next pitch is predictable 58% of the time.

Catcher Framing in the ABS Era

74 catchers, an 18.7 percentage point gap between best and worst framers, and a counterintuitive finding: in the ABS challenge era, good framing may gain value because it influences the batter’s decision to challenge.

The Anatomy of a Missed Call

379,155 called pitches, a 7.2% miss rate, and the half-inch cliff where human judgment breaks down. Plus: challenge value by count, catcher framing ranges, and where umpires miss most.

The Count Tells You Everything

We built a pitch prediction model on 729,827 pitches. XGBoost beat the marginal baseline by 2.1pp — but beat the count-conditional baseline by only 0.5pp. The count already encodes nearly all predictive information.

Two Myths the Data Kills

Pitchers don’t measurably lose their command late in games (r = 0.007). Plate discipline doesn’t predict future hitting (r = -0.019). Two baseball beliefs that don’t survive 729,827 pitches.

On the Research Queue

Every follow-up we’ve promised to come back to — with the article that owes you the answer and when we expect to deliver it.

01

Arm-Angle Gambit — All-Star break re-test

Sixteen pitchers had dropped their arm slots when we priced the gambit — enough to find a tax, not enough to settle the case. By the break the pool should roughly double. Does the slot credit stay at zero, does the lost four-seam ride hold up in a bigger sample, and can anything separate the nine droppers who got better from the seven who got worse?

02

Bat-Speed Arms Race — All-Star break re-test

Due: All-Star break (Jul 14, 2026) ·From: The Bat-Speed Arms Race

Round one landed a borderline positive: within the same hitter, an extra tick of bat speed looked worth about a quarter of a run per 100 plate appearances, with no whiff cost — but the margin still grazed zero. With twice the 2026 sample, does “no treadmill” graduate to “swinging harder works,” or fade back into the noise?

03

ABS Walk Spike — All-Star break re-test

Due: All-Star break (Jul 14, 2026) ·From: Three Weeks Later: The Walk Spike Is Fading

We pinned roughly a quarter of the 2026 walk spike on the new zone and named the pitchers paying for it. At twice the sample: does that share hold, do more pitchers show a genuine within-season adjustment to the robo-zone, and does Mason Miller — flagged by one of our two methods but not confirmed by the other — finally get over the line?

04

April Sell List — All-Star break re-check

Due: All-Star break (Jul 14, 2026) ·From: The April Sell List

Did the six sleepers (Caglianone, Pereira, Barrosa, Basallo, Mayo, House) actually break out? Did the six fakes (Pages, Rice, Trout, Judge, Carroll, Muncy) regress as projected? And did Murakami’s signal hold once we have 80-plus MLB games on him?

05

Catcher Challenge Skill Separation

Due: Mid-season ·From: Catchers Are Better Challengers

By mid-season, top catchers will have 30–50 challenges each — finally enough to separate real challenge skill from small-sample luck. The early leaders (Dingler 7-for-7, O’Hoppe 10-for-12, Ramírez 7-for-9) are all within one another’s error bars; more reps will tell us whether anyone truly stands apart.

06

The ABS Effect on Umpires (full-season)

Due: Mid-season + end of season ·From: The Four Kinds of Zone

Early returns show every umpire with 3+ games in 2026 improving on his 2025 accuracy baseline, by about 2.6 points. Is the challenge system actually making umpires better, or is the early sample lucky? A mid-season checkpoint, then a definitive end-of-season answer.

07

ABS Challenge Decision Optimizer

Due: When sample ≥ 2,000 challenges

Given the count, the inning, the score, and the challenges you have left — should you burn one? A proper optimization model for the question every dugout now faces, once the league crosses 2,000 total challenges (it’s adding roughly 250 a week).

08

NPB-to-MLB power translator

Due: Before next April retrospective ·From: The April Sell List

Munetaka Murakami’s 56-homer NPB peak has no MLB comparable — Ohtani’s best in Japan was 22 — so our model had no choice but to treat him as league-average. Before the next hot-start retrospective, we want an honest power translation for Japanese sluggers in his tier, even if it’s only a range.