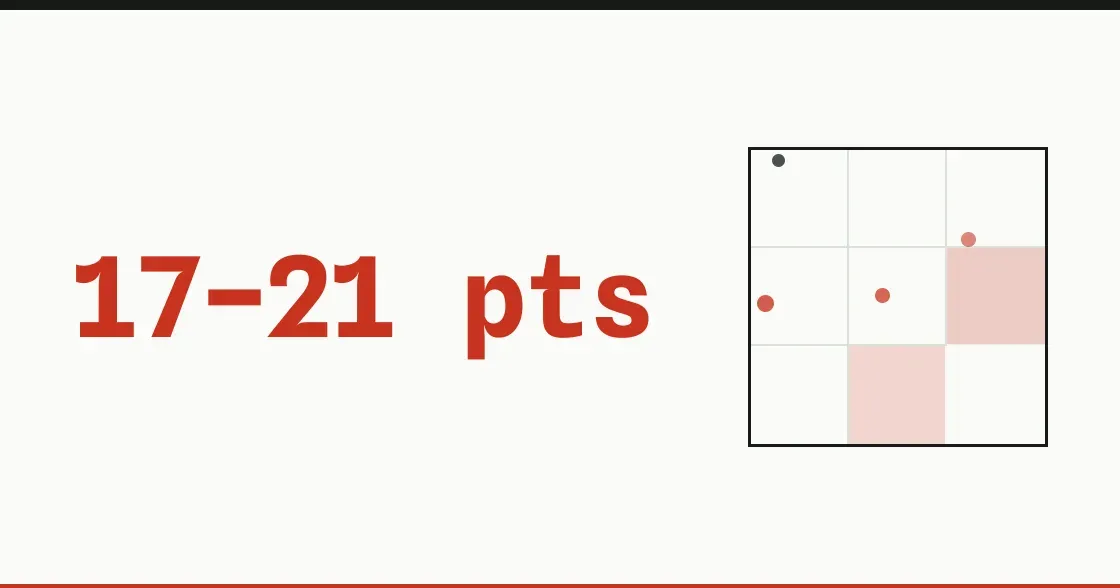
Baseball’s most institutionalized number — the ~25-point times-through-the-order penalty — is real: after selection correction the paired estimate is 17–21 wOBA points (the estimate controls who is batting and who is pitching; it does not control the manager’s decision to leave him in). What carries it is the surprise. The fastball’s 0.36-mph decline replicates in every season but its wOBA harm is not established; in the local same-start, same-pitch-count comparison the famous first-pitch ambush reverses (descriptively, −7 to −11 pp); and the signature that survives every in-sample design in both independent pipelines is contact — 1–2 fewer whiffs per hundred pitches, +3.6 to +4.5 points more two-strike contact in the zone (its 2026 sign held out of sample; its magnitude beat the frozen interval). The question the rule is named after — the trip or the pitch count — is unanswerable on these data: at the same pitch count, the third look IS the top of the order.
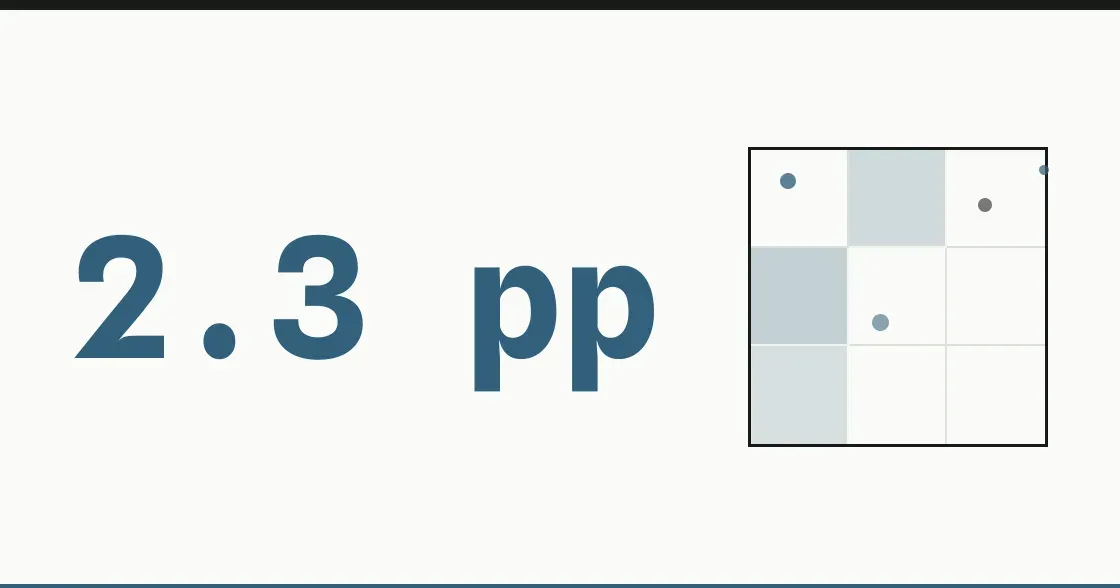
We built the ABS challenge optimizer we promised in July. Two challenges at first pitch are worth about 2.3 points of win probability; the second is worth 60% of the first, so a team with one left is playing a different game than a team with two. The rule is a threshold — challenge when your confidence beats C/(G+C) — and it moves from ~55% sure in a first-inning 0-0 count to ~5% in the bottom of a one-run eighth, one out, tying run on second, 3-2, one challenge left. Measured against it, the league’s mistake is hoarding, not panic (0.57 vs 0.05 points per team-game): three-quarters of team-games end with a challenge unused, and the bar for using one falls in the right direction but too little and too late. Two independent methods, converged within 4% on the headline; team differences are noise, so no leaderboard.
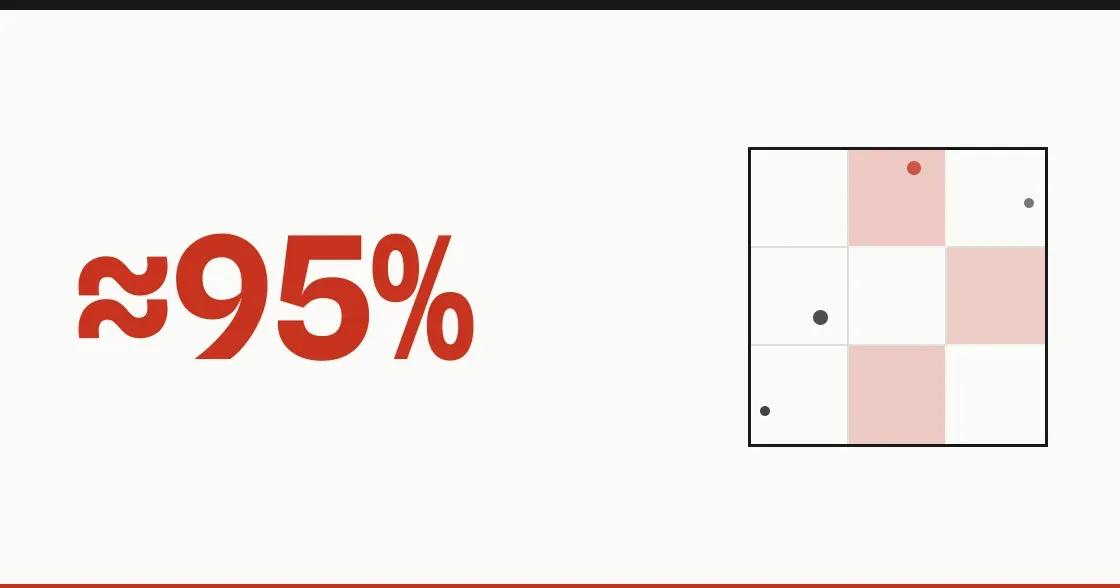
Cal Raleigh’s 2026 collapse — a .394 wOBA to .255 — lives in the ball off the bat: about 95% of the lost run value in a model-based decomposition. What pitchers throw him accounts for roughly none of it (−4% and +6% in two independent estimates, intervals around zero), his swing decisions and miss rate for about −0.7%, and his bat speed is intact (73.1 → 72.5 mph). The pattern is consistent with a centering loss; flush contact fell from about one in seven balls to one in twenty. The one visible change in his swing — soft stuff met about 2.4 inches deeper — was already in place in late August 2025, while he was hitting .475 hard-hit, and it does not explain the loss; the IL did not start it, and the cause is not identifiable from tracking data. “They went upstairs and he’s chasing” is an artifact of the fixed 2026 ABS box. Two model families, cross-verified; sealed lines and endpoints we’ll score in October.